
|
Check out our article in Production Machining in the link below, outlining potential ways in which to improve communication between machine shops and engineers using finite element analysis.
https://www.productionmachining.com/articles/who-are-the-dfm-consultants-you-are
0 Comments
Today, I would like to explore a slightly different topic and something that may be considered a bit controversial by todays standards. Given my personal experience in the field and observations over time, however, this is something that I think requires some thought and questioning. Many may disagree and are equally entitled to their own opinion. My goal in writing this piece is not to give an absolute opinion or what is right or wrong, but to continue to open the door for the opportunity to have an open discussion exploring the issue from multiple angles and to bring clarity that we really don't always know everything. The topic of the day is women in engineering - in particular, the observation of what appears to have been and to be a big push to get more women into technical areas such as engineering, and further, what appears to be a push for equal outcome of men and women in the field, as opposed to equal opportunity. When I was in high school and college, everyone seemed to praise those that decided to pursue careers and schooling in technical sciences, in particular engineering. Often, the unintentional message in this, or what was internalized by some, by so vehemently pushing women into these fields, however, was that it was “unacceptable” to pursue “non-technical” fields. Jobs in non-technical fields would lead to "unstable" careers, lower "status," less "freedom" etc. etc. But, what does this even mean? What defines something technical vs. non-technical in the first place? And what defines something as good or bad? Is this not dependent on each individual and their own preferences, passions, and skillsets? These labels and definitions of what should or shouldn't be ok require careful examination to determine independently what is and is not true for each individual. And, when certain beliefs, or sides of arguments, becomes so strongly pushed or accepted as true, it usually puts me in a position of taking a step back and trying to take a larger view of the issue at hand in order to better understand what is at play and what we might be missing that lies under the surface. Additionally, focusing too heavily on one side often instigates the need to counterbalance - kind of like what this piece or writing is attempting to do. So, let’s begin by asking the questions:
Often, in my experience, we humans try to find solutions to what we think are “problems,” when in reality, they are problems that we inherently create ourselves because we are human and we like to solve problems. This desire to solve problems leads to innovation and development and some pretty cool shit, but it can also lead to some fairly damaging mentalities. It is not either-or. There is so much more to our world than we know and can conceive of. Let’s take this a bit further and ask a few more questions:
I am in no way, shape, or form saying that women should not be able or to pursue engineering, enjoy engineering, or be in engineering, but rather that the pursuit should be for the right reasons for the individual. Some women may want to go into engineering in the same way that some men may want to go into art, for example. Furthermore, the women that want to be in engineering make kick-ass engineers, but in my experience, going into it because people tell you you are good at it or you “think” you should, creates inner conflict, a series of failed jobs, and a point to question what you are doing and why. Let's ask a few more questions:
These questions are for everyone, including myself to explore, which is why I pose them. The one thing I do know, however, is that nature seems to find a way of self-organizing into the most optimal configurations for itself. So, what would happen if we learned from this and allowed these systems to organize themselves naturally? Allowed the ratio of male to female engineers to determine itself? Maybe it is natural for there to be a skewed ratio of men to women in engineering that results from equal opportunity, rather than equal outcome. Maybe it isn't. And further, why should we expect equal outcome, so long as each individual has the opportunity to explore different avenues. Maybe this is not true. Maybe it is. Maybe the answer lies in the middle. Until next time.... In this discussion, we will be exploring concepts in energy and momentum conservation using as an example the collision of a sphere with a rigid bar. As usual, these models are built in the IMPETUS Afea Solver and are meant to explore simple concepts in mechanics, in addition to things to keep in mind when performing analysis of larger systems and models. This model consists of a deformable steel sphere impacting a rigid, steel bar. The steel bar is constrained in XYZ translation and XYZ rotation and the sphere is constrained in XY translation using *BC_MOTION. The sphere is given an initial velocity of -10 m/s using *INITIAL_VELOCITY. Contact is defined between the sphere and the bar using *CONTACT. Friction is not considered in the contact interface. Penalty stiffness at the contact interface is is explored and is varied between the calculated value of 0.1e14, 1e14, and 10e14. The impact model setup is shown in Figure 1. 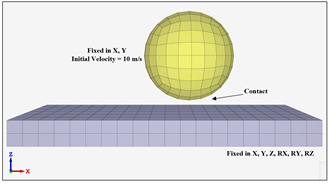 Figure 1. Model setup for sphere impacting rigid bar. The sphere is modeled with *MAT_METAL in order to capture plastic deformation during the collision. The yield stress vs. plastic strain curve is shown in Figure 2. Strain rate hardening was not considered in this model. 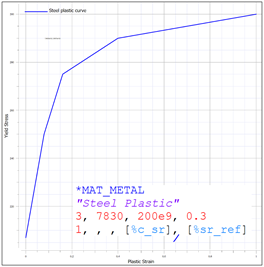 Figure 2. Yield stress vs. plastic strain for *MAT_METAL steel curve. Note stress is in Mpa. For this two body system, we can write the coefficient restitution for the collision as:  If both objects are rigid and kinetic energy is conserved, the coefficient of restitution would be equal to 1 and the initial and final velocity of the sphere would be equal and opposite. In reality, however, some energy is lost during the collision due to deformation, contact, etc. and the coefficient of restitution will be less than 1, indicating that some kinetic energy of the sphere is lost (final velocity less than initial velocity). In this study, the effect of penalty stiffness and element order/smoothing on the response of the sphere during and after impact will be explored. In IMPETUS, element order and smoothing is easily modified using the commands *CHANGE_P-ORDER and *SMOOTH_MESH, which apply the changes at runtime. Figure 3 contains images of the mesh for the three cases (linear elements, cubic elements, and cubic elements with smoothing). Note that smoothing removes element facets (or sharp corners), which could also be achieved by using a larger number of linear elements as well. Increasing mesh density and quadratic elements were not explored in this study. 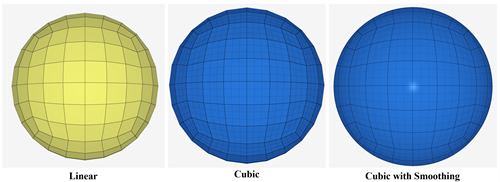 Figure 3. Linear, cubic, and cubic smoothed mesh for sphere collision model. In models that involve contact, it is important to check contact penetration and ensure that its value is reasonable. In reality, tuning a numerical model properly requires physical test data to compare and validate against. There are many parameters that can be used to validate the model and it is up to the analyst to determine the most influential factors. What is clear, however, is that many parameters can affect the response of a model, so it is wise not to trust results without exploring what they mean and what their sensitivities are. Table 1 outlines the cases run for this study. Penalty stiffness factors of 0.1e14, 1e14, and 10e14 were used in conjunction with linear elements, cubic elements, and cubic elements with smoothing applied. The maximum contact penetration for each case is also shown. Maximum contact penetration for linear elements, cubic elements, and cubic elements with smoothing is visually shown in Figure 4. 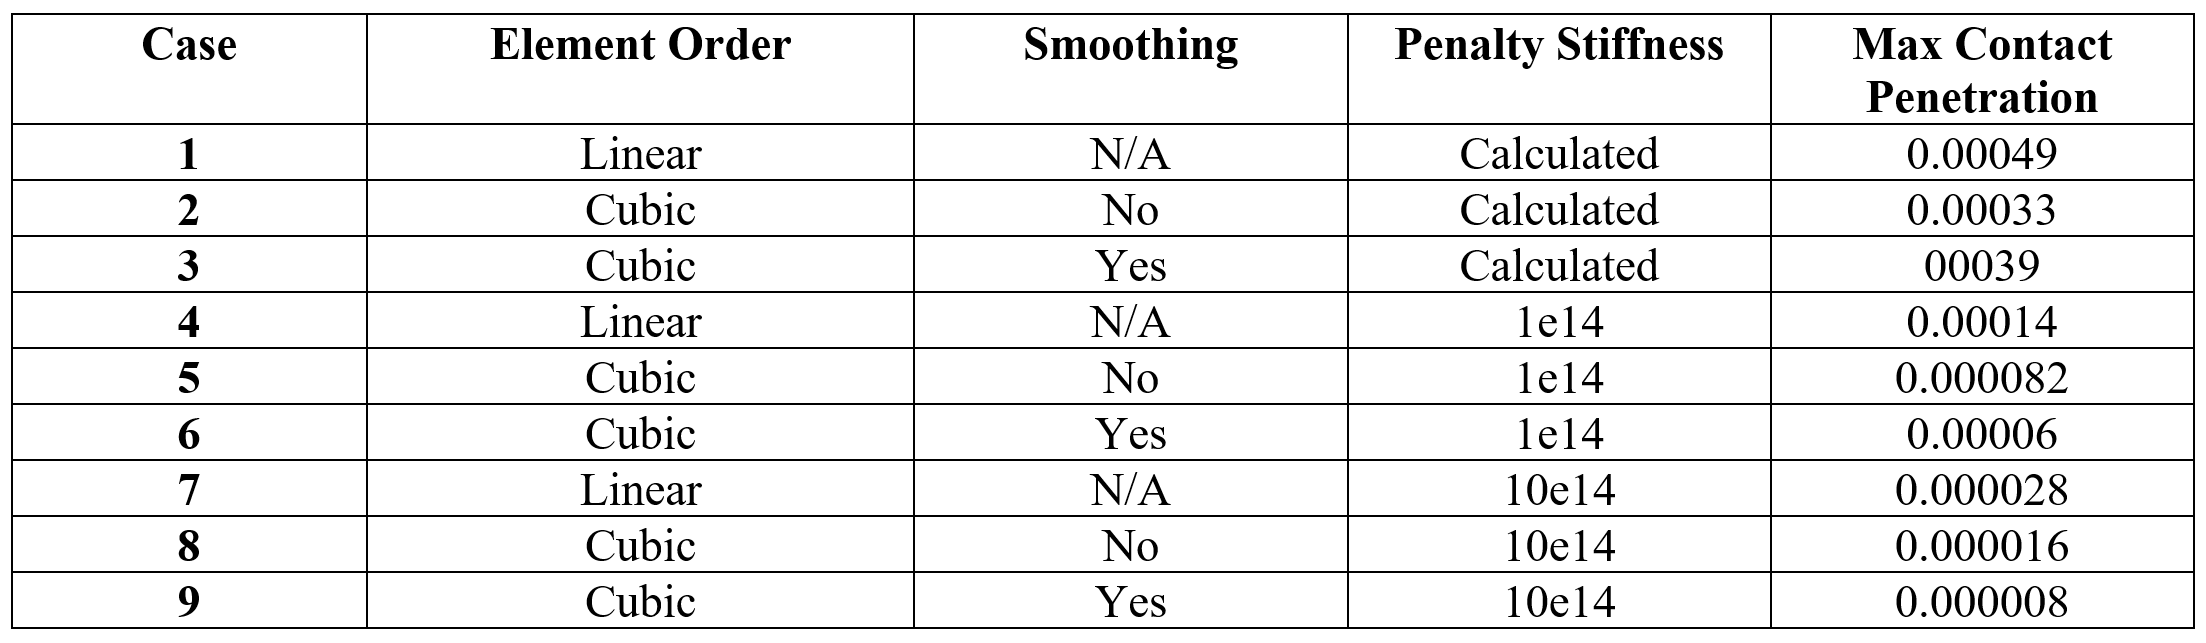 Table 1. Outline of cases run in this study, including values for element order, smoothing, penalty stiffness, and contact penetration. 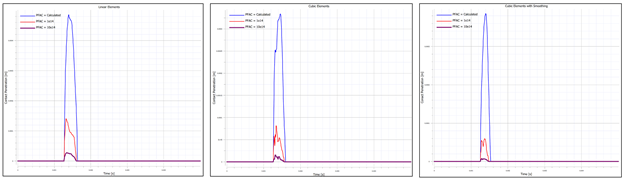 Figure 4. Contact penetration for linear elements, cubic elements, and cubic elements with smoothing. Figure 5 contains the final velocity of the sphere as a function of time for each of the three cases. Figure 6 contains the kinetic energy, plastic energy, and contact elastic energy as a function of time for each of the three cases. From the plots, it can be seen that the contact penetration decreases as the element order is increased, when smoothing is introduced, and when the penalty stiffness is increased. What is of importance in this data is not necessarily the absolute values, but the fact that modifications to penalty stiffness and element order and/or mesh smoothing can affect the contact behavior and should be considered when analyzing larger systems and models. The differences in contact penetration as a result of changes in penalty stiffness can also be observed in the macro-response of the system, primarily in the form of energy transfer. The primary metric of interest is the final velocity of the sphere, however, plastic energy, kinetic energy, and contact elastic energy are also explored. Table 2 contains the three cases run using cubic elements and smoothing, but varying penalty stiffness factors. Figure 5 contains the final velocity of the sphere as a function of time for each of the three cases and Figure 6 contains the kinetic energy, plastic energy, and contact elastic energy as a function of time for each of the three cases. 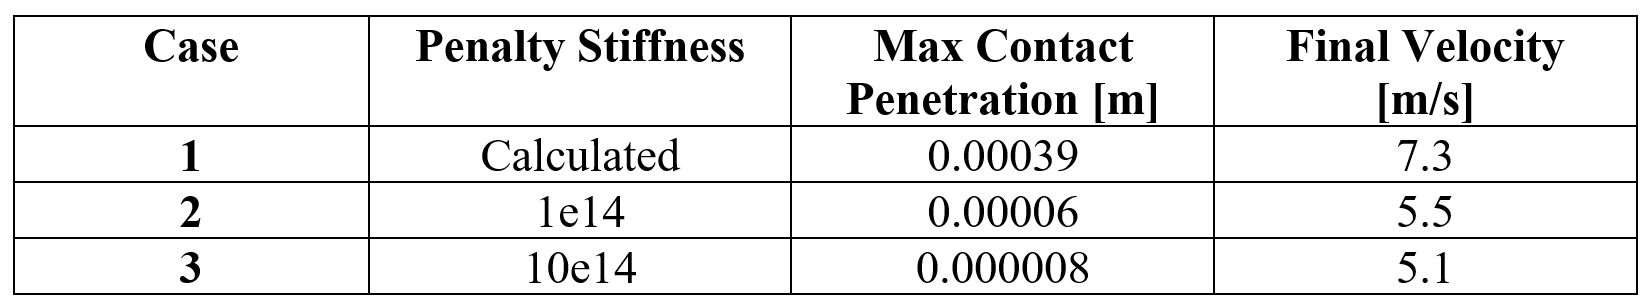 Table 2. Three cases run with cubic elements and smoothing, including penalty stiffness and final velocity of the sphere.  Figure 5. Final velocity of sphere as function of time for varying penalty stiffness. 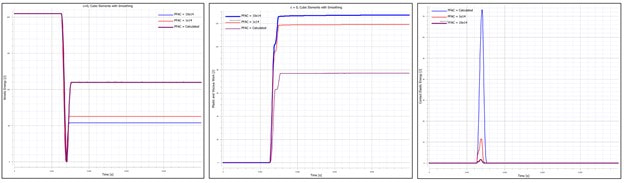 Figure 6. Kinetic energy, plastic energy, contact elastic energy for varying penalty stiffness. As can be observed, an increase in the penalty stiffness results in a decrease in velocity and a thus a decrease in kinetic energy. Simultaneously, the plastic energy increases and the contact elastic energy decreases. As in most problems, energy is conserved from its initial to final state and is, as a result, transformed to and from various forms – in this case from elastic energy and kinetic energy to plastic energy. The contact algorithm in IMPETUS uses the penalty method, which essentially implements a stiff spring between the interfaces to resist penetration. A spring has an energy that varies directly with stiffness and the square of displacement and a force that varies directly with stiffness and directly with displacement. As a result, as the penalty stiffness is increased, the contact penetration decreases (stiffer spring means less deflection for a given force) leading to a similar decrease in contact elastic energy. Furthermore, as the penalty stiffness increases, the stiffness of the interface increases leading to a larger amount of energy lost to plastic deformation of the sphere. This increase in plastic energy similarly reduces the kinetic energy and resulting final velocity, as observed.
While the phenomenon observed make physical and numerical sense, their primary purpose in this study is to demonstrate trends and the sensitivity of a system’s response to changes in single parameters in order to highlight the fact that care must be taken when tuning a finite element model. Ideally, one has additional information in the form of test data or macro properties that can be used to properly validate the system response. Contact penetration, however, should always be checked and additional parameters likely need to be tuned as well. Of great importance is typically the material model. As stated before, garbage in = garbage out, and one of the largest sources of error can come from an inaccurate material model. The primary purpose of this study was to demonstrate the importance of checking contact penetration and in understanding how changes in small parameters can affect the global response of a model. In simple models, it may be straightforward to determine the largest source of error, however, when analyzing larger systems, these small things become very important to check. In today’s discussion, we will be exploring the behavior of crushable foam under uniform compression impact conditions. The models are once again built and run in the IMPETUS Afea Solver®. The test model consists of two rigid plates and a 50 mm x 50 mm x 50 mm cube of aluminum crushable foam, as show in Figure 1. The lower plate (yellow) is constrained in XYZ translation and XYZ rotation. The upper plate (blue) is constrained in XY translation and XYZ rotation, able to translate in Z only. All boundary conditions were applied using *BC_MOTION. Contact is defined between the two plates and the foam cube with a friction coefficient of μ = 0.2 using *CONTACT (varying friction and contact parameters were not explored in this model). The upper plate has a physical mass of 0.9 kg and is prescribed an initial velocity in the Z-direction using *INITIAL_VELOCITY. The primary validation metric for this model is the maximum displacement of the upper plate and the energy absorbed by the foam. This model does not account for the strain rate sensitivity of the foam response.  Figure 1. Impact model setup, consisting of two rigid plates in contact with a crushable foam cube. An initial velocity is applied to the top plate and the system behavior is analyzed. The cube is defined with the *MAT_FOAM material model (as in the previous post) with a crush strength of 2 Mpa and a Poisson ratio of 0. The stress-volumetric strain curve is shown in Figure 2. The damping factor beta was set to 0.5 and the penalty stiffness for the contact algorithm was set to 1e14 as small penetrations were observed when the penalty stiffness was calculated automatically (0.1e14). 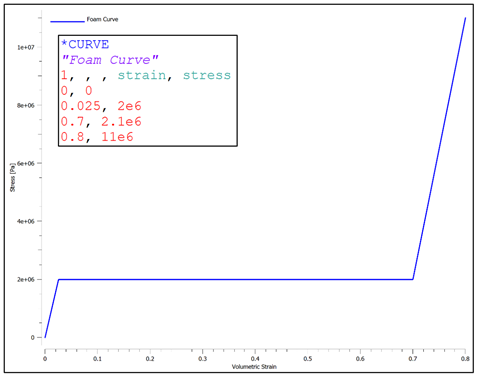 Figure 2. Stress-volumetric strain curve for aluminum crushable foam modeled with *MAT_FOAM. Note that crushable foam has what is called a “crush plateau,” over which stress is constant for increases in strain as the material compresses. This region, up to ~50%-60% strain, is the ideal region for impact energy absorption prior to foam densification. The work done in compressing the foam can be approximated using the standard definition of work for uniform loading. Designing systems that require energy absorption involves understanding these properties and how they affect the system behavior. Modeling and simulation, in conjunction with drop tests and other mechanical tests, can be a useful tool not only in better characterizing the behavior of an energy absorption interface, but also in optimizing the design of the energy absorber (such as thickness, material parameters, and other geometric parameters). Before digging into the behavior of the numerical model, it is important to explore the basic physics of the problem, which can also then be used to validate the results of the analysis. In its simplest terms, this problem represents the transformation of kinetic energy into work done by the aluminum foam (energy absorbed due to compression). This could represent, for example, an object being dropped from a given height onto a padded surface (transformation of potential energy into kinetic energy into work done by the material to stop the object or reduce its rebound velocity). In this case, the work done due to foam compression in the small elastic region of the curve will be ignored. State 1 represents an object moving with a given velocity and state 2 represents the maximum displacement of the object and the foam (where the objects velocity is zero). The energy balance can then simply be written:  For a given initial velocity, we can solve for the expected maximum displacement (assuming the plate’s velocity is reduced to zero at this point). Note that energy loss due to friction is ignored, as is the potential energy due to displacement of the plate.  The maximum possible displacement geometrically in this problem is 50 mm, which represents contact of the plate with the ground, as if the foam were to magically disintegrate. The simple expression for energy absorbed by the foam as force*distance is only valid, however, over the region of its crush plateau that is linear, so it likely makes more sense to restrict displacements to values where volumetric strain is less than ~60%. For this simplified problem, volumetric strain is given by:  Plugging a maximum displacement of 30 mm into the energy balance results in an upper bound on the initial velocity of: 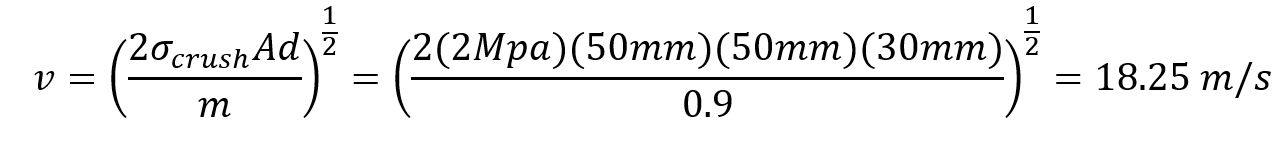 Note also that, in order for the foam to compress, the force imparted by the plate on the foam must be equal to or larger than the crush strength of the foam. If the force is less than this, the plate will experience a collision with the foam and will bounce back without compressing. This force provides a lower bound to the velocity. In this study, initial velocities from 15 m/s to 23 m/s will be explored. Table 1 contains the model parameters for the cases run, the predicted maximum displacement from the simplified energy balance, the observed maximum displacement from the IMPETUS model, and the predicted and observed energy absorbed by the foam. Note that case 4 shows discrepancy between predicted and observed displacement and energy absorbed due to the velocity being large enough to compress the foam into its nonlinear regime (i.e. the simple energy balance would need to be modified to account for the fact that stress is no longer constant for increases in strain). Further note that the observed energy absorbed is slightly lower than the predicted values, likely due to the simplified energy balance not accounting for minor losses due to friction, etc. 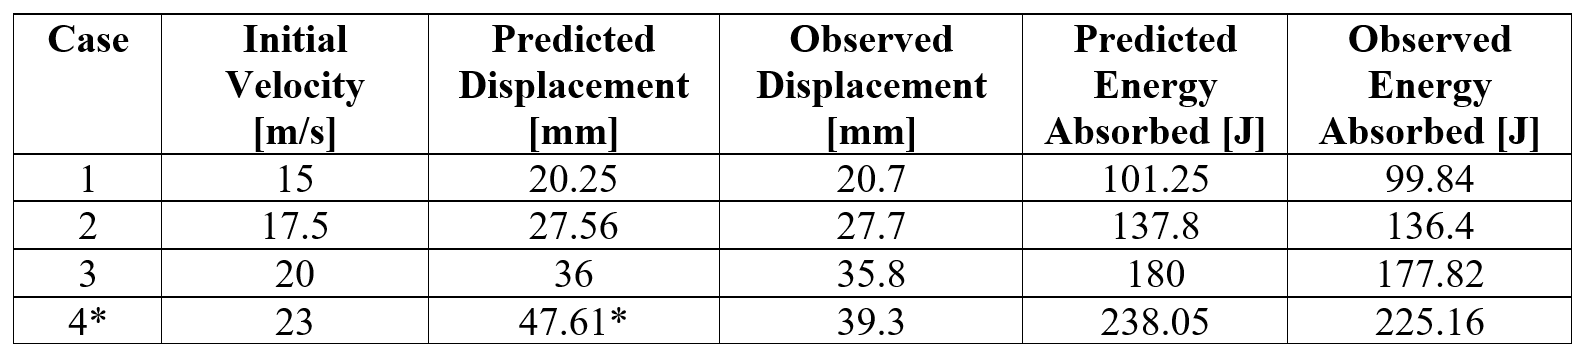 Table 1. Cases explored in this study with initial velocities, predicted and observed maximum displacements, and predicted and observed energy absorbed during impact. Figure 3 shows visually the maximum displacements achieved in each of the four cases explored and Figure 4 shows the displacement of the top plate as a function of time for each of the cases. 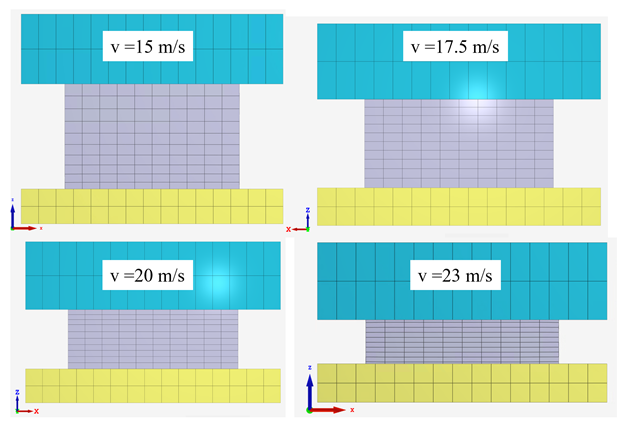 Figure 3. Maximum displacement/compression of foam and plate. 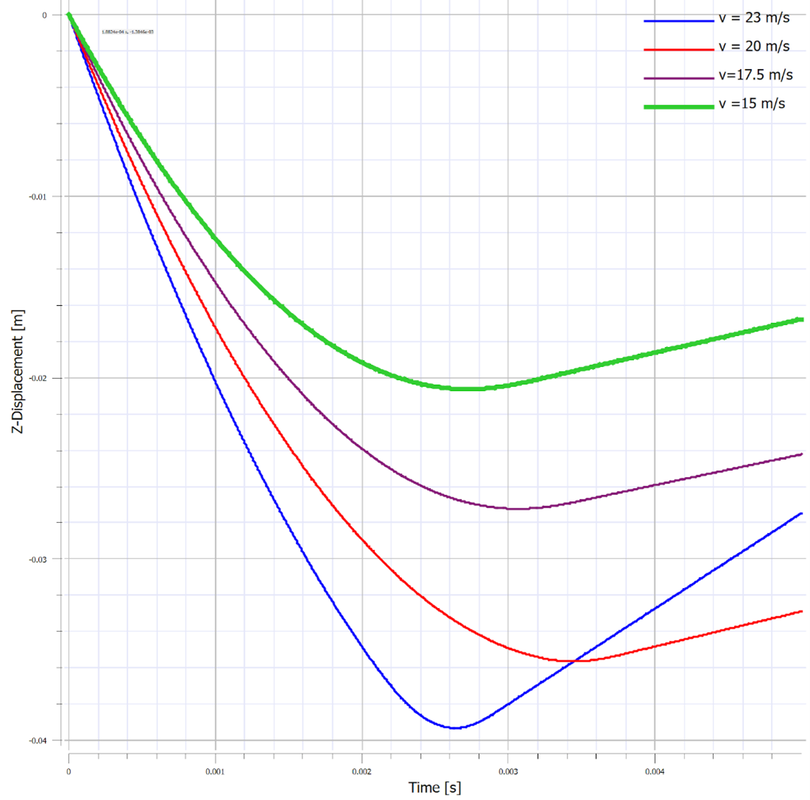 Figure 4. Displacement vs. time for each of the four cases in this study. As expected, the maximum displacement increases with increases in velocity. It can be observed also, that in each case, the top plate displaces to its maximum value, after which its velocity changes direction and it moves upward (i.e. it rebounds). It can be observed further that for initial velocities of 15 m/s, 17.5 m/s, and 20 m/s, the displacement profiles are fairly similar, but that the profile is much sharper for a velocity of 23 m/s. All of these results make sense if certain assumptions in our energy balance are loosened. Figure 5 shows the velocity vs. time for each of the cases in this study and Figure 6 shows the internal energy vs. time for each of the cases in this study. 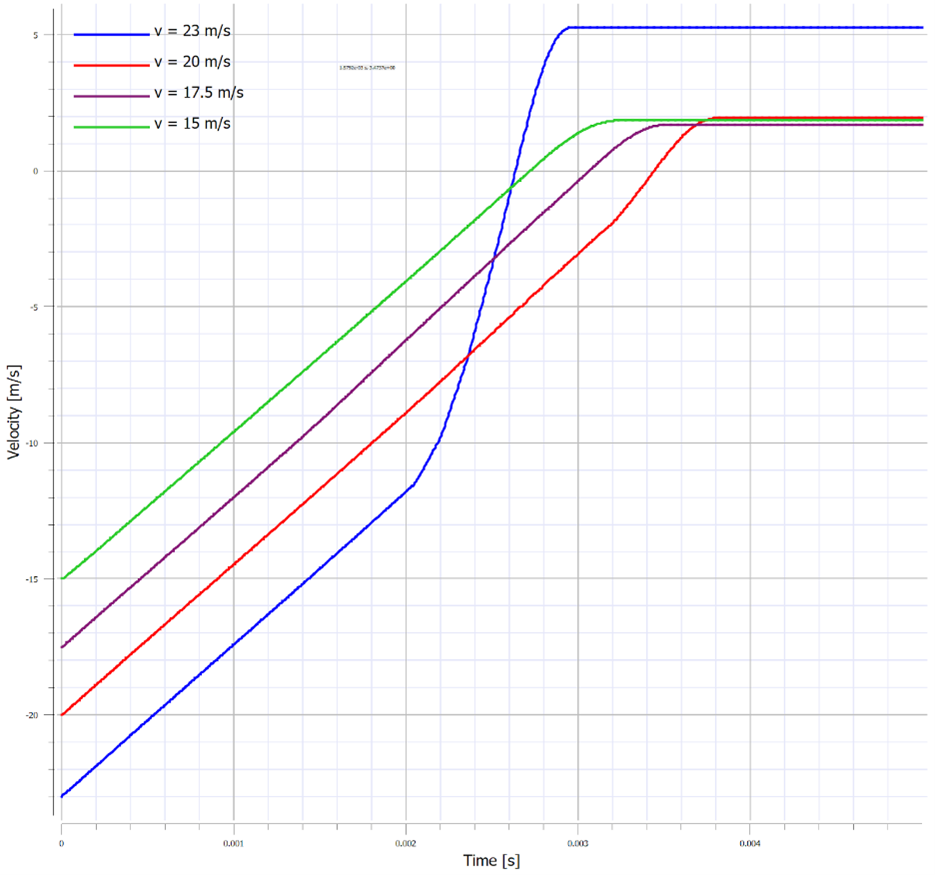 Figure 5. Velocity of the top plate vs. time for each of the four cases in this study. 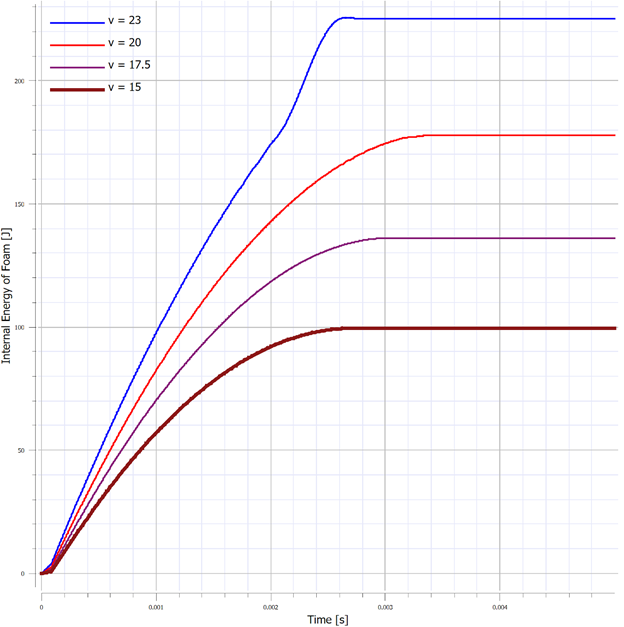 Figure 6. Internal energy of foam vs. time for each case in this study. Firstly, for a velocity of 23 m/s, the simple energy balance does not account for the energy absorbed during foam densification where the stress increases significantly. This densification essentially serves as a more solid interface to collide and rebound from, resulting in a shorter time over which the impact/rebound takes place (sharper curve), “less” energy absorbed during the actual collision, and a larger velocity/displacement after rebound, as observed. Secondly, not all kinetic energy is absorbed in these models, and in each case, the top plate rebounds with a much smaller velocity. In each of the first three cases (15 m/s, 17.5 m/s, and 20 m/s), the rebound velocity is fairly similar. If we go back to our energy balance, these first three cases stay essentially in the crush plateau region of the foam stress-strain curve, so energy absorbed in the densification region is not of interest. Energy/work done in the elastic region of the curve, however, could contribute to the results observed (elastic energy is recoverable unlike the plastic work done in the crush plateau region). Elastic strain energy is defined as: 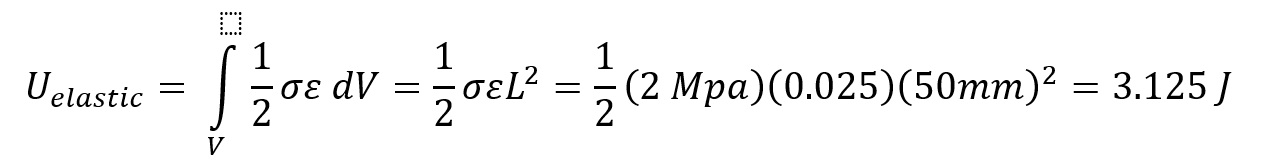 Considering this elastic energy converted to kinetic energy of the plates and foam, a final velocity in the range of 2 m/s would be anticipated, which is what is observed. Note also that, as expected, the internal energy absorbed by the foam increases with increases in velocity. Figure 7 shows a representative plot of internal energy and kinetic energy of the system as functions of time. 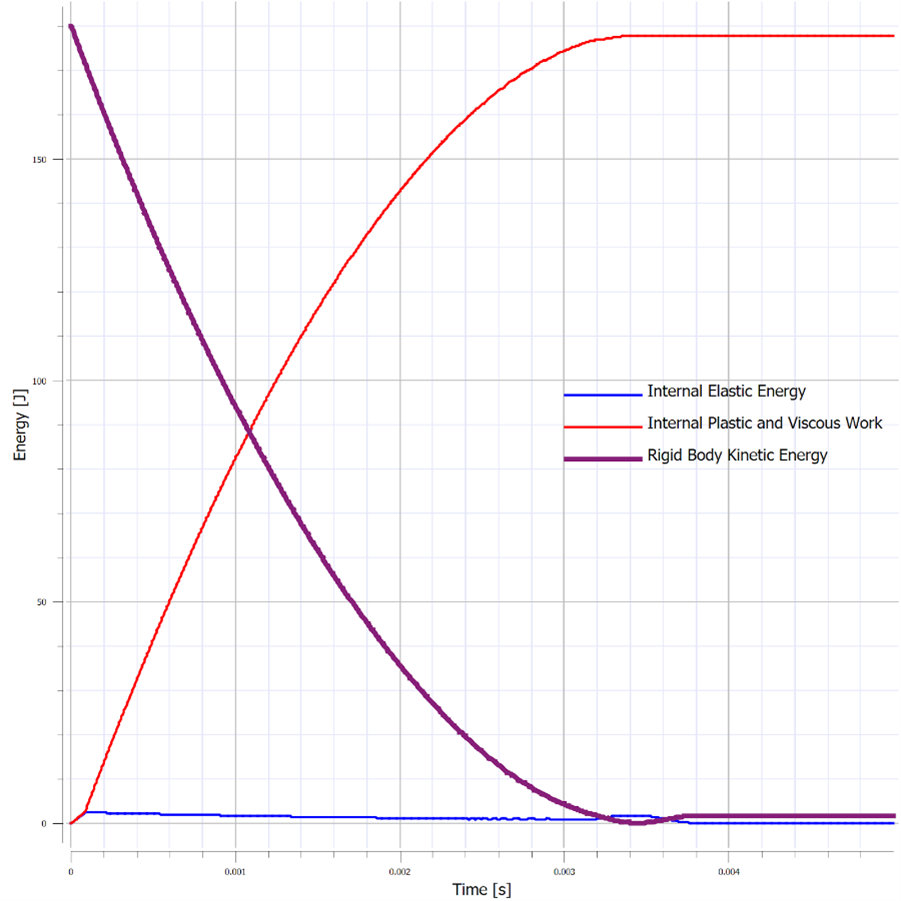 Figure 7. Internal energy and kinetic energy as a function of time. The transformation of kinetic energy into energy absorbed by the foam can be observed in this plot, where internal energy is a minimum and kinetic energy is a maximum at t=0 and internal energy is a maximum and kinetic energy is a minimum at maximum time. This study illustrates the behavior of crushable foam under uniform compression due to impact of a rigid plate. The change in displacement and energy transfer characteristics as functions of initial velocity can be observed. Additionally, this study illustrates the region over which energy absorption is most effective – following the crush plateau, rebound of the object is much more significant. These forms of models can be useful in understanding the ability foam to absorb energy in cases where impact between objects occurs and how various properties (crush strength, foam thickness and geometry, etc.) can be tailored to the design of interest. Of course, in reality, simulation would be used in conjunction with testing to ensure that the models and material models are validated, however can still be used to explore trends and sensitivities.
In the coming weeks, we will be further exploring large deformation of foam and applications of IMPETUS to drop tests. We all drop stuff, so lets understand it more! In the coming weeks, I will be writing a few articles that explore the importance of understanding and checking basic components of finite element models, particularly when dealing with any form of nonlinearity, including material nonlinearity, geometric nonlinearity, or contact nonlinearity. The goal of these articles is to explore key components of finite element analysis using simple models whose concepts apply and propagate to larger scale models and systems. All models in this series are built using the IMPETUS Afea Solver®, an explicit nonlinear transient dynamic finite element solver. The use of this solver allows for such studies and analysis to be performed efficiently and intuitively due to its use of parameters, in-built geometry options, mesh commands, and unique element formulation. To kick off this series, we will first examine a simple uniaxial compression test of crushable foam. In this discussion, we will be exploring the importance of accurate material models, the effects of mesh density on model response, and numerical stability in explicit models. This model consists of a 50mm x 50mm x 50mm cube fixed at the bottom face in XYZ translational degrees of freedom and fixed at the top face in XY translational degrees of freedom. Note that solids do not support rotation at nodes, so rotational degrees of freedom are not constrained. A displacement that is linearly ramped over a time of 0.1 seconds is applied to the top face in the Z direction, causing uniform axial compression of the foam. Both the constraints and displacement were applied using the *BC_MOTION command. Illustrations of the model setup, including boundary conditions and geometry, and the applied displacement are shown in Figure 1. The model shown consists of 10x10x10 linear elements, however, additional models were run with 5x5x5 linear elements and a single linear element. A single model was also tested using a solution time of 1 second to ensure that the shorter solution time could approximate a quasi-static solution and did not induce inertial effects. 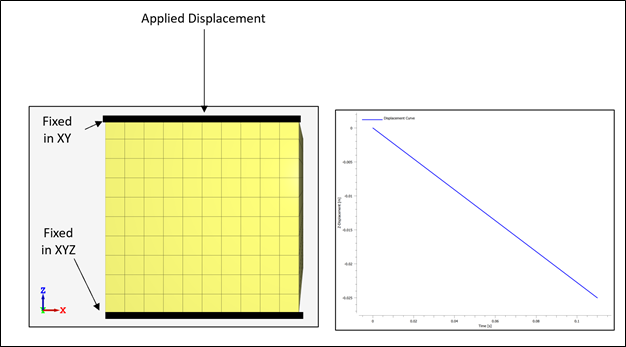 Figure 1. Model setup and displacement curve. The cube was constructed of a representative model of aluminum crushable foam using *MAT_FOAM. A Poisson ratio of 0 was used and the stress-volumetric strain curve for the model is shown below in Figure 2. Note that this curve is purely representational and not taken from actual material test data. If a material model were being used in a larger finite element model, accurate material data would need to be obtained through testing or a viable material database to properly calibrate/validate the model. Additional calibration may also need to include geometry similar to the end-use case. Note that for crushable foam, there is an initial period of elastic yield, a constant stress compression, followed by foam densification where the stress increases. In an "ideal" case, no hardening would be present (i.e. the central curve would be flat). The lack of hardening, however, presents numerical issues and the global model response dependence on material hardening will be explored. As such, two foam material models were used in this study, one with no hardening (i.e. a flat central curve) and one with hardening (i.e. minor slope to central curve). This was accounted for by modifying the value of the y-coordinate of the third point in the curve definition as shown in Figure 2. 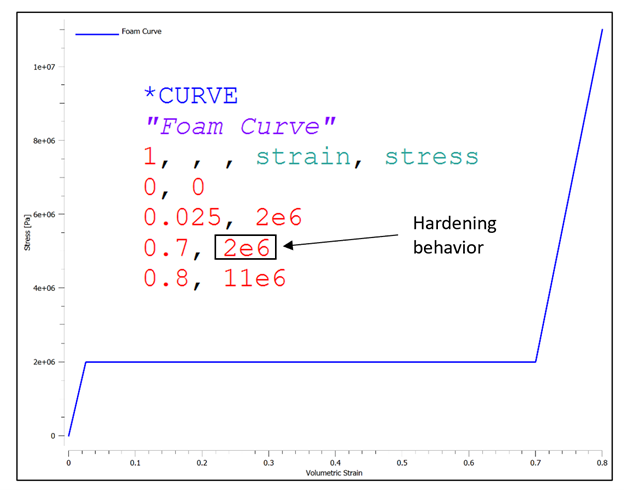 Figure 2. Stress vs. volumetric strain for representative *MAT_FOAM material model. Table 1 outlines the cases explored in this initial study, including number of elements, element order, presence of hardening, and y-coordinates for the start and end point of hardening behavior (all x-coordinates occur at 0.7). The key metric assessed in this model is effective stress and its relationship to mesh density and hardening. Later studies will explore element order and strain rate for uniaxial compression cases and punch cases. It is important to note that IMPETUS is an explicit solver, meaning that solutions are conditionally stable (numerical stability not guaranteed like in implicit models), and inputs and outputs must be checked carefully to ensure that the behavior makes physical sense. As is usually the case in numerical methods, your outputs are only as good as your inputs - “garbage in = garbage out." Accurate material models, mesh density, and element type/order are of particular importance, in addition to intuitive sanity checks that verify the material response is what would be expected based on physics of the problem. Note also that IMPETUS does not use shell elements and the number of element types are significantly reduced, allowing for variability due to selected element type to be significantly reduced. 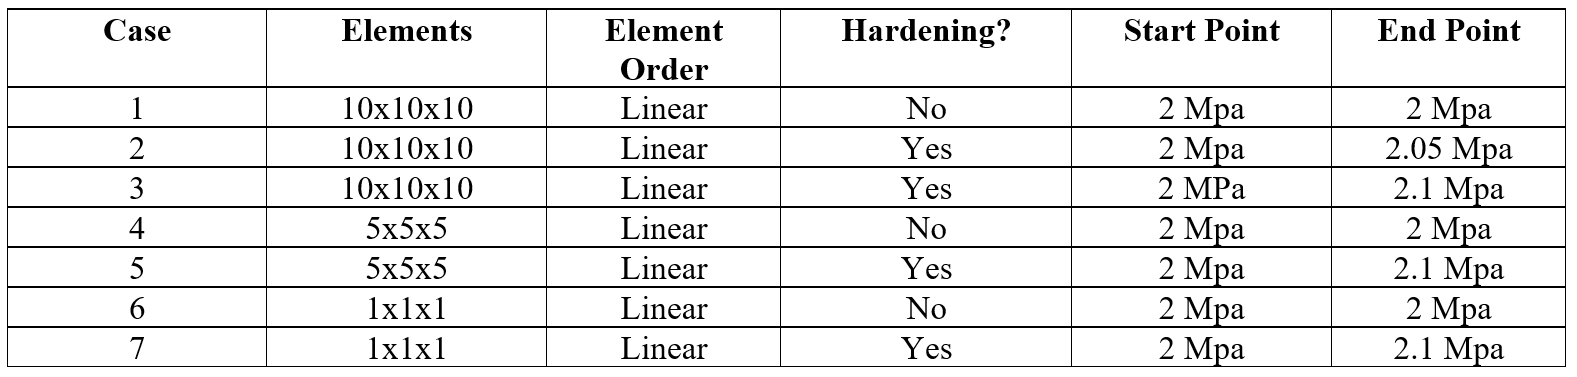 Table 1. Test cases explored in initial study. Figures 3, 4, and 5 illustrate the anticipated deformation responses of a uniaxial compression model for crushable foam with minimal Poisson effect. Figure 3 corresponds to case 3 (with hardening), Figure 4 corresponds to Cases 4 and 5 (with and without hardening), and Figure 5 corresponds to cases 6 and 7 (with and without hardening). Note that the cube compresses uniformly and does not exhibit lateral expansion when numerically stable. Also note that this response was seen at lower mesh densities with and without hardening. 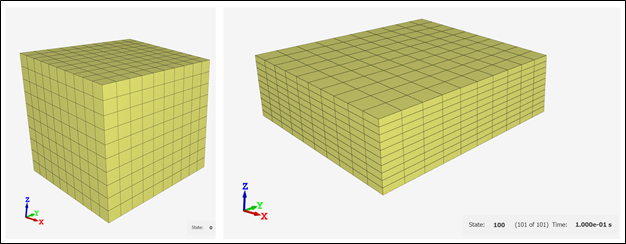 Figure 3. Anticipated deformation response of 10x10x10 model with hardening. 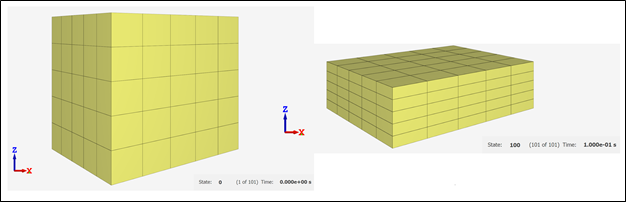 Figure 4. Anticipated deformation response of 5x5x5 model with and without hardening. 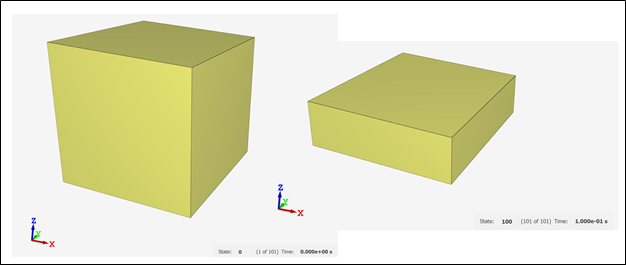 Figure 5. Anticipated deformation response of single element model with and without hardening. Figure 6 shows the deformation response and effective stress response for the 10x10x10 model without hardening (Case 1 and 2). Figure 7 further illustrates the effective stress in various elements of the 10x10x10 model with varying hardening parameters (2.0 Mpa, 2.05 Mpa, and 2.1 Mpa). 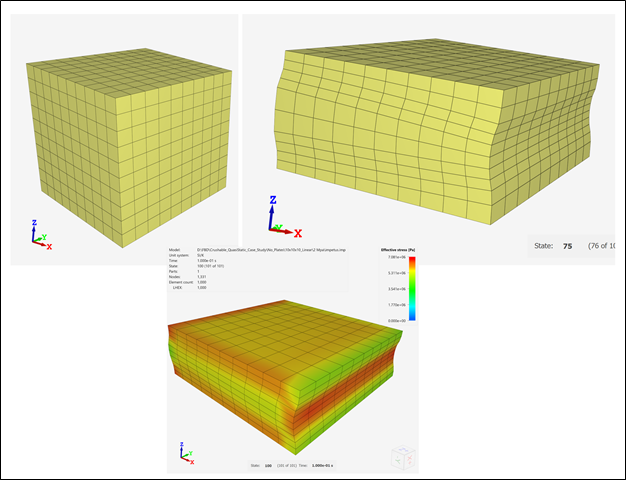 Figure 6. Deformation and stress response for 10x10x10 model without hardening.  Figure 7. Effective stress response of 10x10x10 model with and without hardening in the material model definition. Note the nonuniform stress response and outward bowing/bending in the model. Given the boundary conditions and understanding of the physics of the problem, this solution seems unlikely to be physical. Furthermore, this stress response was dependent on mesh density and was seen when the mesh density was increased to 10x10x10, but not observed in the global deformation response at lower element densities. Observing this kind of model response is usually indicative of some form of numerical instability, particularly when dealing with explicit solvers. One can see that, for the 10x10x10 model, spurious stresses develop when there is no hardening (a flat curve), that the magnitude and dispersion of these stresses decreases when the hardening is increased to 2.05 Mpa, and that the effect is fully eliminated when the hardening is increased to 2.1 Mpa. The convergence of the element response to the defined material behavior confirms this. This particular observation and phenomenon, that spurious stresses develop at varying mesh densities and varying material curve input, illustrates the importance of validating a material model prior to using it in full scale simulations. It is key to ensure that the material response that is observed matches the input for simple test cases that reflect the use cases in order to avoid the propagation of non-physical responses into larger models. This is typically done by modifying relevant parameters in the material model until the model response matches the test data gathered. The dependence of the response on mesh density can be further observed in Figures 8 and 9. While the global response in the 5x5x5 model did not show instability visually, minor instabilities can be observed in the plots of the stress responses without hardening These instabilities are also eliminated when hardening is added. No instabilities are seen in the single element model. 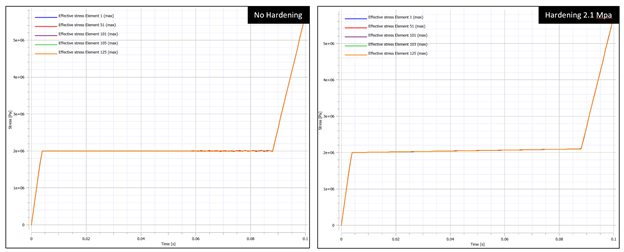 Figure 8. Effective stress response for 5x5x5 model with and without hardening. 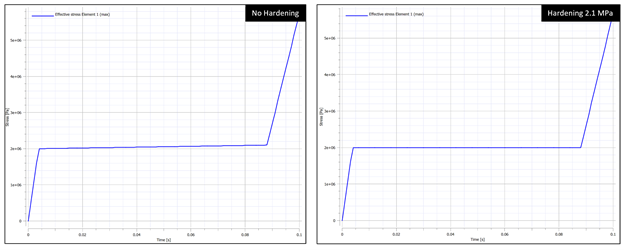 Figure 9. Effective stress response for single element model with and without hardening. In this particular case, the cause of the instability and unanticipated stress response was the need to add hardening behavior to the material model. In other situations in which there is test data available, other parameters may need to be modified to achieve the desired result. Additionally, it was seen that mesh density affected the response of the foam, bringing up another key point on response convergence. Performing mesh sensitivity or convergence studies when performing analysis is key to ensuring you are accurately capturing the full response of your system. If the model stress response changes significantly with changes in mesh density, it is likely that the mesh is not detailed enough to capture the response. Sensitivity studies, in general, are good tools to explore the stability of models. It may be necessary, additionally, to consider validating a material model with test data at a specified, set mesh density that allows for the simulation to solve in reasonable time frames. Explicit modeling presents some challenges due to solution time and accuracy depending on the size of the smallest element in the model. As usual, there is a fine line to walk between required model accuracy and computational time.
Through this simple example, we can see that the base components of finite element models - the simple things such as mesh density and material model - are incredibly important when building an analysis model and in ensuring that the results and response are accurate and reflective of the physical behavior. While this example is very simple and explores only a few parameters, there are a few key take-aways:
|
Archives
December 2022
Categories
All
|
 RSS Feed