
|
In today’s discussion, we will be exploring the behavior of crushable foam under uniform compression impact conditions. The models are once again built and run in the IMPETUS Afea Solver®. The test model consists of two rigid plates and a 50 mm x 50 mm x 50 mm cube of aluminum crushable foam, as show in Figure 1. The lower plate (yellow) is constrained in XYZ translation and XYZ rotation. The upper plate (blue) is constrained in XY translation and XYZ rotation, able to translate in Z only. All boundary conditions were applied using *BC_MOTION. Contact is defined between the two plates and the foam cube with a friction coefficient of μ = 0.2 using *CONTACT (varying friction and contact parameters were not explored in this model). The upper plate has a physical mass of 0.9 kg and is prescribed an initial velocity in the Z-direction using *INITIAL_VELOCITY. The primary validation metric for this model is the maximum displacement of the upper plate and the energy absorbed by the foam. This model does not account for the strain rate sensitivity of the foam response.  Figure 1. Impact model setup, consisting of two rigid plates in contact with a crushable foam cube. An initial velocity is applied to the top plate and the system behavior is analyzed. The cube is defined with the *MAT_FOAM material model (as in the previous post) with a crush strength of 2 Mpa and a Poisson ratio of 0. The stress-volumetric strain curve is shown in Figure 2. The damping factor beta was set to 0.5 and the penalty stiffness for the contact algorithm was set to 1e14 as small penetrations were observed when the penalty stiffness was calculated automatically (0.1e14). 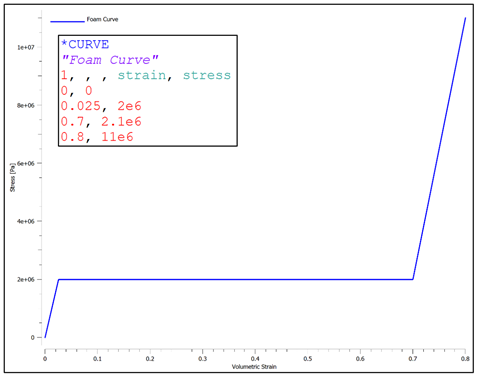 Figure 2. Stress-volumetric strain curve for aluminum crushable foam modeled with *MAT_FOAM. Note that crushable foam has what is called a “crush plateau,” over which stress is constant for increases in strain as the material compresses. This region, up to ~50%-60% strain, is the ideal region for impact energy absorption prior to foam densification. The work done in compressing the foam can be approximated using the standard definition of work for uniform loading. Designing systems that require energy absorption involves understanding these properties and how they affect the system behavior. Modeling and simulation, in conjunction with drop tests and other mechanical tests, can be a useful tool not only in better characterizing the behavior of an energy absorption interface, but also in optimizing the design of the energy absorber (such as thickness, material parameters, and other geometric parameters). Before digging into the behavior of the numerical model, it is important to explore the basic physics of the problem, which can also then be used to validate the results of the analysis. In its simplest terms, this problem represents the transformation of kinetic energy into work done by the aluminum foam (energy absorbed due to compression). This could represent, for example, an object being dropped from a given height onto a padded surface (transformation of potential energy into kinetic energy into work done by the material to stop the object or reduce its rebound velocity). In this case, the work done due to foam compression in the small elastic region of the curve will be ignored. State 1 represents an object moving with a given velocity and state 2 represents the maximum displacement of the object and the foam (where the objects velocity is zero). The energy balance can then simply be written:  For a given initial velocity, we can solve for the expected maximum displacement (assuming the plate’s velocity is reduced to zero at this point). Note that energy loss due to friction is ignored, as is the potential energy due to displacement of the plate.  The maximum possible displacement geometrically in this problem is 50 mm, which represents contact of the plate with the ground, as if the foam were to magically disintegrate. The simple expression for energy absorbed by the foam as force*distance is only valid, however, over the region of its crush plateau that is linear, so it likely makes more sense to restrict displacements to values where volumetric strain is less than ~60%. For this simplified problem, volumetric strain is given by:  Plugging a maximum displacement of 30 mm into the energy balance results in an upper bound on the initial velocity of: 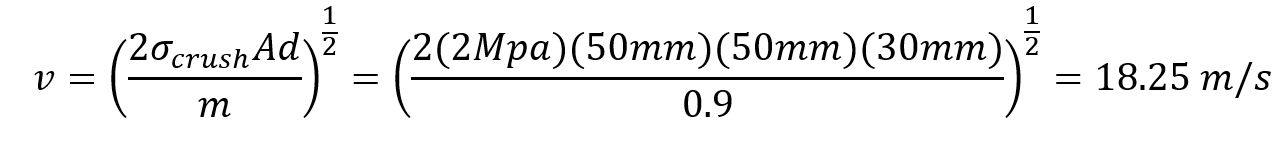 Note also that, in order for the foam to compress, the force imparted by the plate on the foam must be equal to or larger than the crush strength of the foam. If the force is less than this, the plate will experience a collision with the foam and will bounce back without compressing. This force provides a lower bound to the velocity. In this study, initial velocities from 15 m/s to 23 m/s will be explored. Table 1 contains the model parameters for the cases run, the predicted maximum displacement from the simplified energy balance, the observed maximum displacement from the IMPETUS model, and the predicted and observed energy absorbed by the foam. Note that case 4 shows discrepancy between predicted and observed displacement and energy absorbed due to the velocity being large enough to compress the foam into its nonlinear regime (i.e. the simple energy balance would need to be modified to account for the fact that stress is no longer constant for increases in strain). Further note that the observed energy absorbed is slightly lower than the predicted values, likely due to the simplified energy balance not accounting for minor losses due to friction, etc. 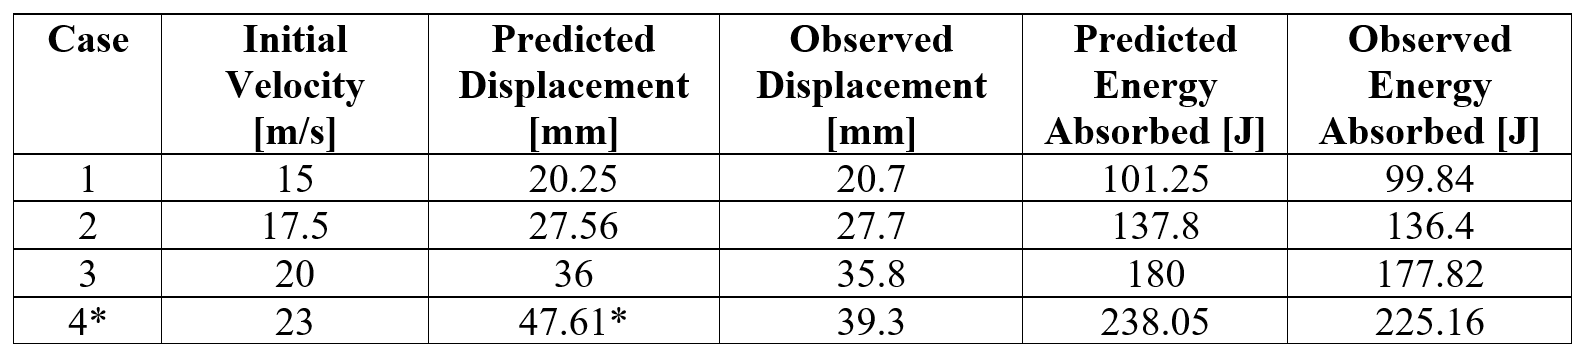 Table 1. Cases explored in this study with initial velocities, predicted and observed maximum displacements, and predicted and observed energy absorbed during impact. Figure 3 shows visually the maximum displacements achieved in each of the four cases explored and Figure 4 shows the displacement of the top plate as a function of time for each of the cases. 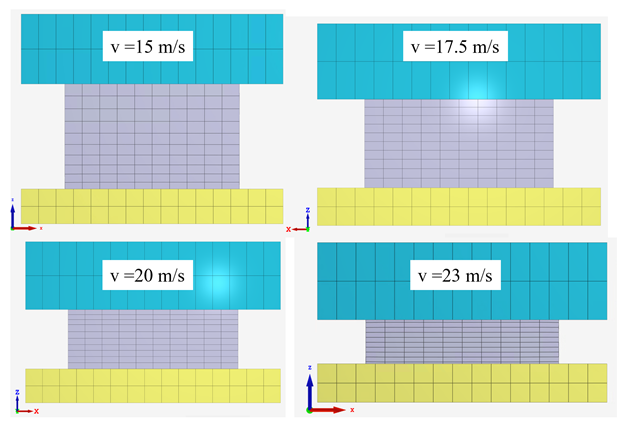 Figure 3. Maximum displacement/compression of foam and plate. 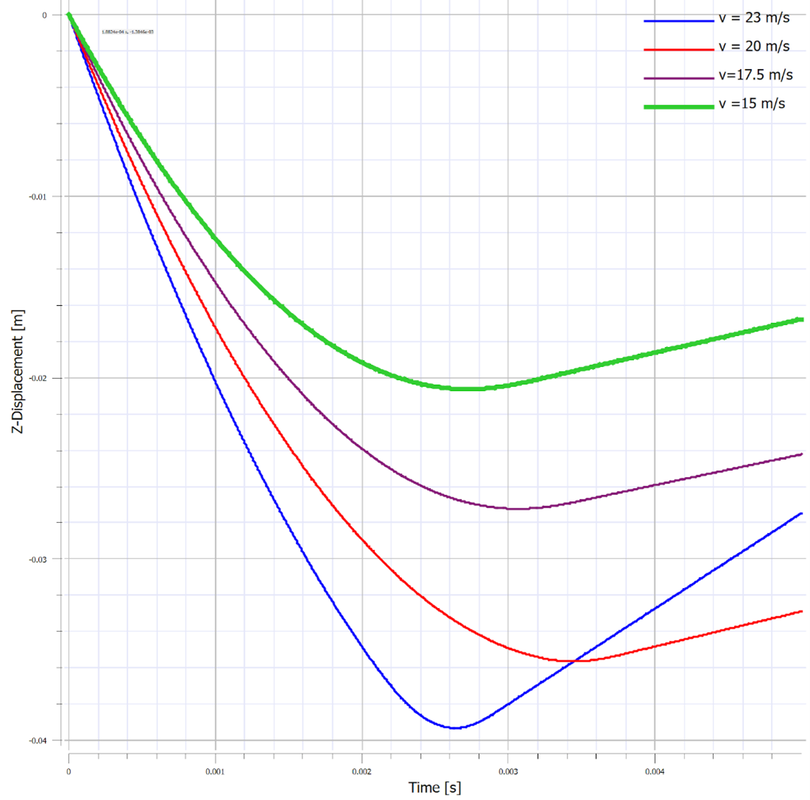 Figure 4. Displacement vs. time for each of the four cases in this study. As expected, the maximum displacement increases with increases in velocity. It can be observed also, that in each case, the top plate displaces to its maximum value, after which its velocity changes direction and it moves upward (i.e. it rebounds). It can be observed further that for initial velocities of 15 m/s, 17.5 m/s, and 20 m/s, the displacement profiles are fairly similar, but that the profile is much sharper for a velocity of 23 m/s. All of these results make sense if certain assumptions in our energy balance are loosened. Figure 5 shows the velocity vs. time for each of the cases in this study and Figure 6 shows the internal energy vs. time for each of the cases in this study. 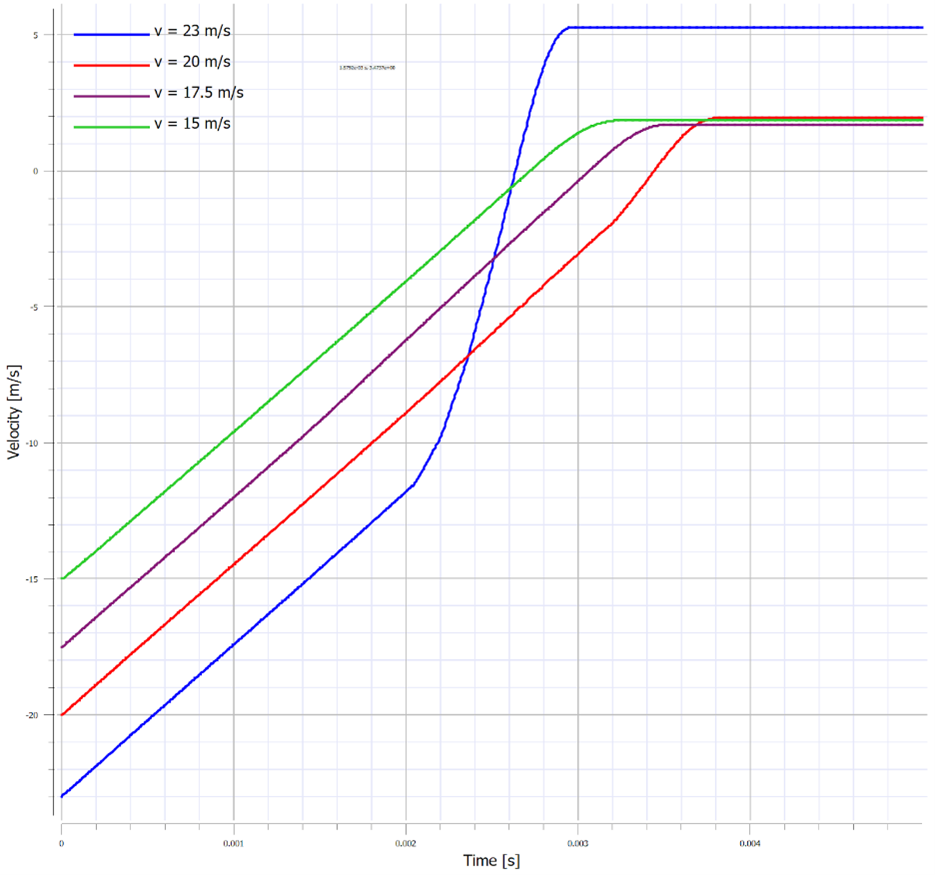 Figure 5. Velocity of the top plate vs. time for each of the four cases in this study. 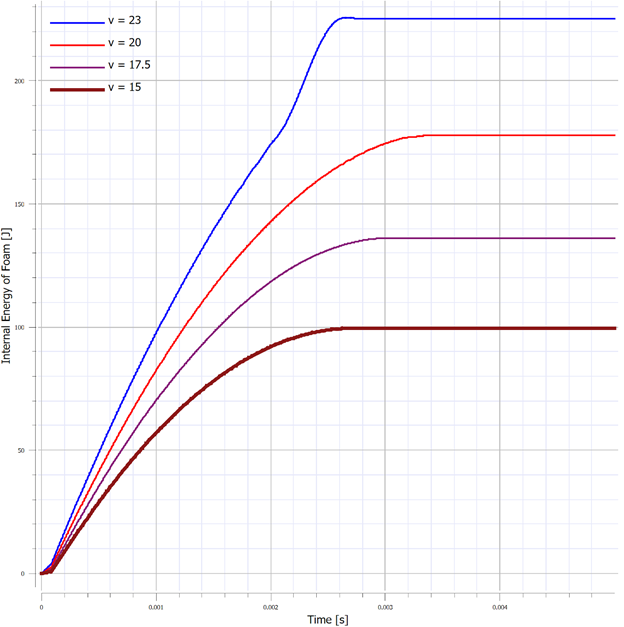 Figure 6. Internal energy of foam vs. time for each case in this study. Firstly, for a velocity of 23 m/s, the simple energy balance does not account for the energy absorbed during foam densification where the stress increases significantly. This densification essentially serves as a more solid interface to collide and rebound from, resulting in a shorter time over which the impact/rebound takes place (sharper curve), “less” energy absorbed during the actual collision, and a larger velocity/displacement after rebound, as observed. Secondly, not all kinetic energy is absorbed in these models, and in each case, the top plate rebounds with a much smaller velocity. In each of the first three cases (15 m/s, 17.5 m/s, and 20 m/s), the rebound velocity is fairly similar. If we go back to our energy balance, these first three cases stay essentially in the crush plateau region of the foam stress-strain curve, so energy absorbed in the densification region is not of interest. Energy/work done in the elastic region of the curve, however, could contribute to the results observed (elastic energy is recoverable unlike the plastic work done in the crush plateau region). Elastic strain energy is defined as: 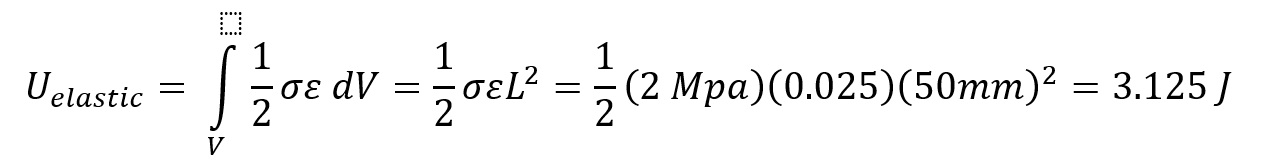 Considering this elastic energy converted to kinetic energy of the plates and foam, a final velocity in the range of 2 m/s would be anticipated, which is what is observed. Note also that, as expected, the internal energy absorbed by the foam increases with increases in velocity. Figure 7 shows a representative plot of internal energy and kinetic energy of the system as functions of time. 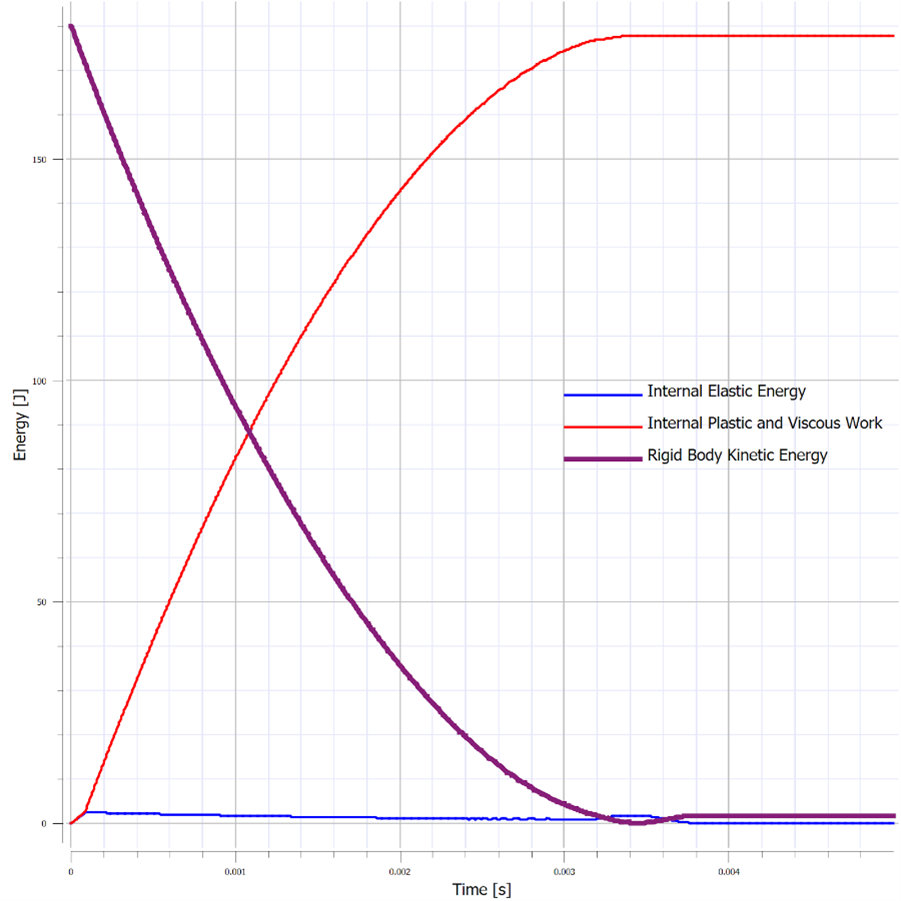 Figure 7. Internal energy and kinetic energy as a function of time. The transformation of kinetic energy into energy absorbed by the foam can be observed in this plot, where internal energy is a minimum and kinetic energy is a maximum at t=0 and internal energy is a maximum and kinetic energy is a minimum at maximum time. This study illustrates the behavior of crushable foam under uniform compression due to impact of a rigid plate. The change in displacement and energy transfer characteristics as functions of initial velocity can be observed. Additionally, this study illustrates the region over which energy absorption is most effective – following the crush plateau, rebound of the object is much more significant. These forms of models can be useful in understanding the ability foam to absorb energy in cases where impact between objects occurs and how various properties (crush strength, foam thickness and geometry, etc.) can be tailored to the design of interest. Of course, in reality, simulation would be used in conjunction with testing to ensure that the models and material models are validated, however can still be used to explore trends and sensitivities.
In the coming weeks, we will be further exploring large deformation of foam and applications of IMPETUS to drop tests. We all drop stuff, so lets understand it more!
1 Comment
Pierre Pelletier
3/21/2022 08:23:25 am
Another very interesting paper. I like the fact that it is of general interest and uses Impetus Leave a Reply. |
Archives
December 2022
Categories
All
|
 RSS Feed